About PopulationSimulatorLogisticMap
"Population simulator" is an application to visually see the changes in the population by using "Logistic Map". You can see the change in the population by the Logistic Map by a line graph and colony size. You can observe...
"Population simulator" is an application to visually see the changes in the population by using "Logistic Map".
You can see the change in the population by the Logistic Map by a line graph and colony size.
You can observe the variation pattern of population variety by changing slightly the initial value.
Logistic Map is not only used in Population Ecology but also considered one of the starting point of Chaos Theory. I developed this app to help people who are studying Population Ecology or Chaos Theory.
*Logistic Map may not necessarily apply to changes in population of actual organisms, because Logistic Map is a model of a simple change of the population.
■What is Logistic Map?
The Logistic Map is the map that is generated from the Logistic Function that has been devised as a variation model of the population of an organism.
It is expressed by the following function.
X(n+1) = a・X(n)・(1-X(n))
In the above equation, the meaning of each symbol is as follows.
・n:Generation (n=1,2,3,...)
・X(n):Value obtained by normalizing the Population of Generation n-th(0≦X(n)≦1)
・a:Value obtained by normalizing the Reproductive Rates(0≦a≦4)
You can calculate the population of the next generation from a population of a certain generation by using this function. In addition, You can predict the variation of the population over the long term by calculating the population of individuals repeatedly in this function.
■Pattern of Logistic Map
Logistic map vary widely depending on the value of "a".
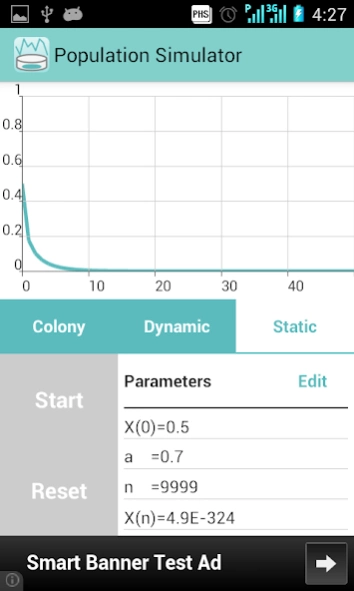
・In case (0≦a≦1) → X(n) converges to 0.
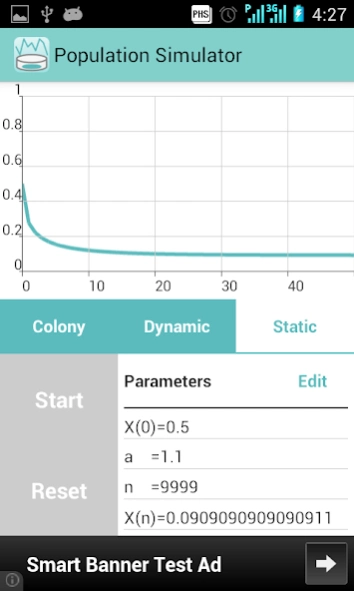
・In case (1<a≦2) → X(n) converges to 1-(1/a).
・In case (2<a≦3) → X(n) converges to 1-(1/a) while oscillating.
・In case (3<a≦3.5699456・・・) → X(n) oscillate between the periodic point individual Power of 2
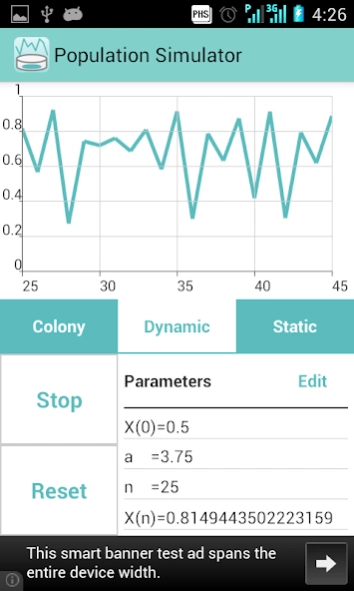
・In case (3.5699456・・・<a≦4) → X(n) Change irregularly.(Chaotic region)*It may become periodically by the value of a.
Please try to observe the changes of Logistic Map by changing the various initial values.
■Main function of App
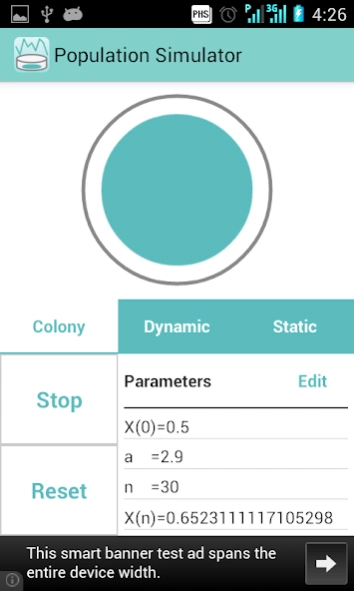
1. Simulation of changes in colony size
2. Line graph of changes in population
Previous Versions
Here you can find the changelog of PopulationSimulatorLogisticMap since it was posted on our website on 2017-06-22 19:04:18.
The latest version is 1.1 and it was updated on 2024-04-22 13:17:10. See below the changes in each version.
PopulationSimulatorLogisticMap version 1.1
Updated At: 2019-05-07
Changes: Supported Android 9.
PopulationSimulatorLogisticMap version 1.0
Updated At: 2014-05-31
Disclaimer
Official Google Play Link
We do not host PopulationSimulatorLogisticMap on our servers. We did not scan it for viruses, adware, spyware or other type of malware. This app is hosted by Google and passed their terms and conditions to be listed there. We recommend caution when installing it.
The Google Play link for PopulationSimulatorLogisticMap is provided to you by apps112.com without any warranties, representations or guarantees of any kind, so access it at your own risk.
If you have questions regarding this particular app contact the publisher directly. For questions about the functionalities of apps112.com contact us.